The Numbers Behind the Move
Bitcoin reached $63,900 during early trading on July 6, 2026, its highest level in two weeks, before settling around $62,600. The move represented a nearly $5,600 recovery from the $58,293 low touched on July 1 — a roughly 9% reversal in under a week. Total crypto market capitalisation rose to approximately $2.23 trillion on the day, up less than 1% across 24 hours, suggesting the Bitcoin move was the driver rather than a broad altcoin rally.
What Triggered It: The June Jobs Report
The direct catalyst was the US Bureau of Labor Statistics' June nonfarm payrolls report, released July 5. The report showed just 57,000 jobs added in June, well below the 180,000 consensus forecast. The unemployment rate ticked up to 4.4%. It was the weakest monthly payroll print since the pandemic-era recovery period and landed on markets already positioned for a hawkish Federal Reserve.
The weak jobs number immediately shifted rate expectations. Fed funds futures markets moved to price in a 79% probability of a September rate cut following the release, up from 43% the day before. A lower-rate environment matters to Bitcoin for two reasons: it weakens the dollar (making dollar-denominated assets like BTC more attractive on a relative basis) and reduces the opportunity cost of holding non-yielding assets.
What a Short Squeeze Actually Is
A short squeeze occurs when a large number of traders have bet that an asset's price will fall — by borrowing and selling the asset today, expecting to buy it back cheaper later. When the price moves against them (upward), those positions accumulate losses that force traders to buy the asset back to close their positions, which itself pushes the price higher. The buying pressure from forced position closures accelerates the initial move.
In Bitcoin's case, Coinglass data showed $450 million in short positions liquidated across major exchanges in the 24 hours following the jobs report — one of the largest short liquidation events of 2026. The speed of the move from $59,500 to $63,900 is consistent with this dynamic: organic buying alone rarely generates that kind of velocity.
Bitcoin's 2026 Macro Correlation
One of the clearest patterns in Bitcoin's 2026 price action has been its tight correlation to US interest rate expectations. Bitcoin's all-time high of roughly $126,000 came in October 2025, when the Fed had already cut rates twice and markets expected more cuts to come. The grinding decline through late 2025 and into 2026 tracked a reassessment of that rate path as inflation proved stickier than anticipated.
The June 2026 jobs print is the first meaningful macro data point in several months to support the original rate-cut narrative. Whether it represents a genuine turning point or a temporary reprieve depends on what the July and August inflation readings show.
Technical Levels to Watch
Bitcoin's recovery to $63,900 puts it back above several technical levels that traders were watching:
The $60,000 level has been psychologically important since late 2025. Bitcoin's ability to hold above it in recent weeks — even as it briefly dipped below on July 1 — has prevented a broader sentiment breakdown.
The $65,000–$67,000 zone is the next meaningful resistance, corresponding to the consolidation range Bitcoin traded in for most of June before the selloff. A sustained close above that level would likely attract additional momentum buying.
On the downside, the $57,000–$58,000 range has now been tested twice (February and July 1) without triggering a sustained breakdown, which gives technical analysts a clearer base to work with.
ETF Flows and Institutional Positioning
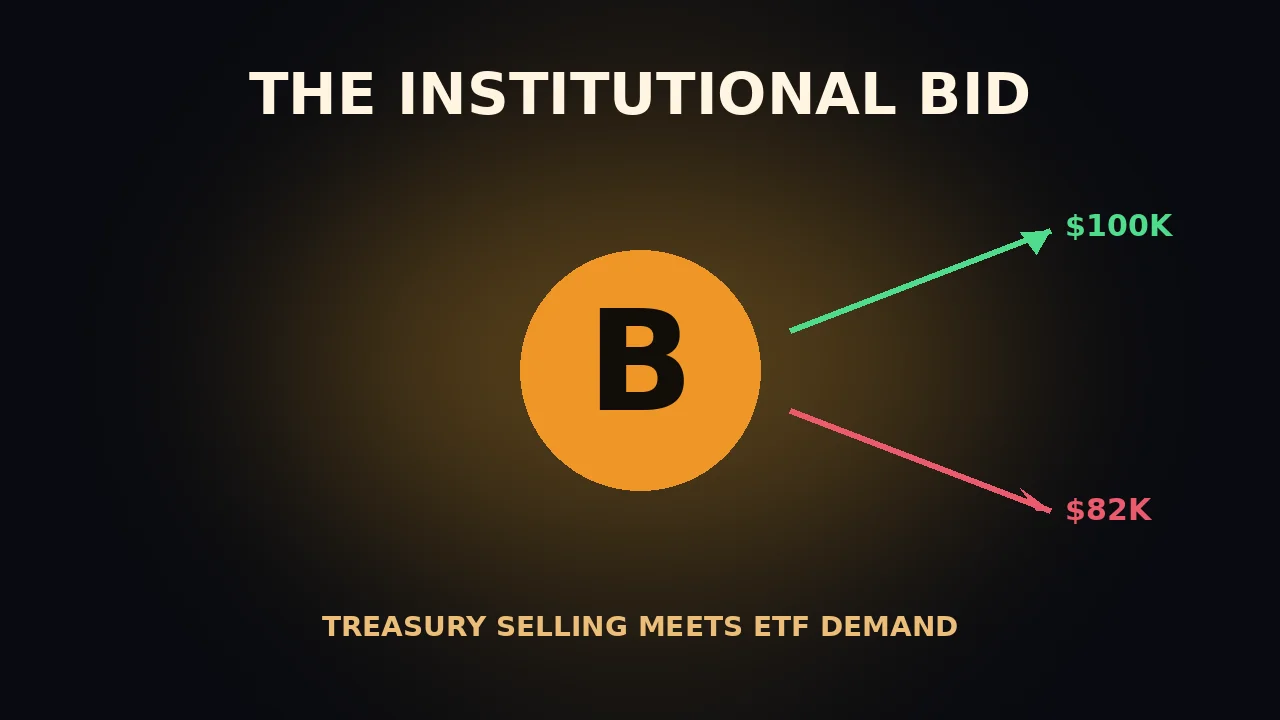
US spot Bitcoin ETFs — which launched in January 2024 — have become the primary vehicle through which institutional investors express their Bitcoin exposure. The ETF flow data around the jobs report was notable: inflows of approximately $310 million came in on July 5 and July 6 combined, reversing three consecutive days of outflows. BlackRock's iShares Bitcoin Trust accounted for roughly $190 million of that total.
The pattern suggests institutional investors are buying the dip on macro weakness, not abandoning the asset class — which is a different dynamic from the retail-driven cycles that characterised Bitcoin's earlier boom-and-bust periods.
What the Next Catalyst Is
With the July rate-cut probability now elevated, the next meaningful data point for Bitcoin will be the July inflation print (Consumer Price Index) due in mid-July. A lower-than-expected CPI number would reinforce the rate-cut narrative and likely push Bitcoin higher. A higher-than-expected reading would reverse the jobs-report optimism quickly.
The July 14 CPI report is the clearest near-term test of whether the $64K move was the start of a recovery or a technically-driven blip in an ongoing bear market.
The Bottom Line
The move to $63,900 on the back of weak jobs data is a legitimate signal that Bitcoin's correlation to rate expectations remains high and that institutional buyers are still willing to bid the dip on macro catalysts. It does not, on its own, confirm that the bear market is over. The next meaningful test is the July CPI print. A benign inflation reading would reinforce the rate-cut thesis and give Bitcoin the macro foundation it needs for a sustained recovery. A hot reading would reverse the jobs-report bounce quickly and likely push Bitcoin back toward the $57,000–$58,000 support range that has held twice this year.
Key Numbers
Bitcoin price at the July 6 high: $63,900. Previous two-week low: $58,293 (July 1). Recovery magnitude: approximately +9.5% in five days. Short positions liquidated in 24 hours following the jobs report: $450 million (Coinglass data). US spot Bitcoin ETF inflows on July 5–6: approximately $310 million. Probability of September Fed rate cut (as of July 5): 79%, up from 43% the previous day. June nonfarm payrolls: 57,000 (consensus forecast was 180,000).






































































Commenting is currently unavailable on this article.